KPI Viewer
This section covers the kpi viewer.
KPI stands for Key Performance Indicator.
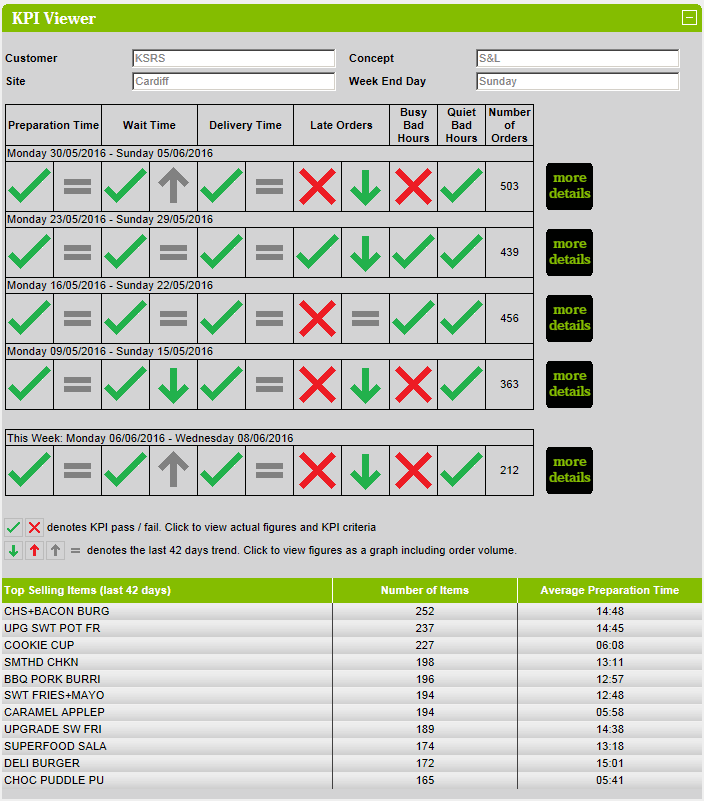
The kpi viewer is displayed via a click-thru (on a site name) from a Dashboard Email.
The kpi viewer displays the kpi and trend analysis for the previous four weeks.
Note: although the trend analysis is by week for four weeks, the actual trend is calculated over the previous 30 days
from the end of each week.
The kpi viewer allows the user to click on any kpi or trend icon which then loads up the actual kpi and trend details for
the selected kpi for the selected week in a new browser window.
The seven KPIs are as follows:
Preparation Time - the time it takes to prepare an order.
Wait Time - the time that an order is waiting to be delivered to the guest once it has been prepared.
Delivery Time - the total time from preparation start until the guest gets their order.
Late Orders - main orders that are late.
Busy Bad Hours - the worst performing busiest hours.
Quiet Bad Hours - the worst performing quietest hours.
Late Check Backs - time between a guest getting their order and the waiting staff checking back to see if the guest is
happy.
The kpi viewer also displays the 11 top selling items in the previous 30 days, detailing the item name, the quantity of
items sold and the average preparation time.
To view further details in a new window, click on the  button.
